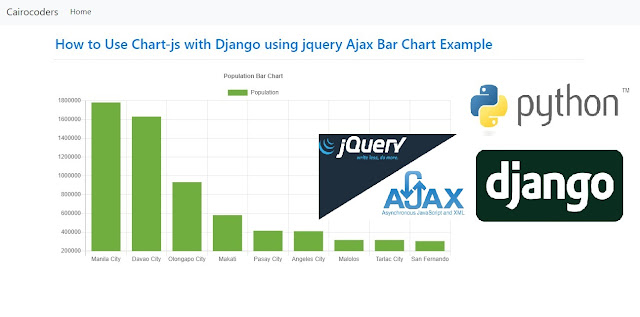
How to Use Chart-js with Django using jquery Ajax Bar Chart Example
In this tutorial we are going to a Bar chart using jquery ajax based on data extracted from our models.
You can download it from Chart.js official website and use it locally, or you can use it from a CDN using the URL above.
https://www.chartjs.org/
npm CDN Files https://www.jsdelivr.com/package/npm/chart.js?path=dist
view.py
#view.py
from django.shortcuts import render
from django.db.models import Sum
from django.http import JsonResponse
from myapp.models import City

def home(request):
    return render(request, 'home.html')

def population_chart(request):
    labels = []
    data = []

    queryset = City.objects.values('name').annotate(population=Sum('population')).order_by('-population')
    for entry in queryset:
        labels.append(entry['name'])
        data.append(entry['population'])

    return JsonResponse(data={
        'labels': labels,
        'data': data,
    })
urls.py
#urls.py
from django.contrib import admin
from myapp import views
from django.conf.urls import url
from django.urls import path, include

urlpatterns = [
    path('admin/', admin.site.urls),
    path('', views.home, name='home'),
    path('population-chart/', views.population_chart, name='population-chart'),
]
models.py
#models.py
from django.db import models

class City(models.Model):
    name = models.CharField(max_length=30)
    population = models.PositiveIntegerField()

    def __str__(self):
        return self.name

    class Meta:
        db_table = 'myapp_city'
templates/home.html
//templates/home.html
{% extends 'base.html' %}

{% block content %}
  <div id="container" style="width: 75%;">
    <canvas id="population-chart" data-url="{% url 'population-chart' %}"></canvas>
  </div>
  <script src="https://code.jquery.com/jquery-3.4.1.min.js"></script>
  <script src="https://cdn.jsdelivr.net/npm/chart.js@2.9.3/dist/Chart.min.js"></script>
  <script>
    $(function () {
      var $populationChart = $("#population-chart");
      $.ajax({
        url: $populationChart.data("url"),
        success: function (data) {

          var ctx = $populationChart[0].getContext("2d");

          new Chart(ctx, {
            type: 'bar',
            data: {
              labels: data.labels,
              datasets: [{
                label: 'Population',
                backgroundColor: '#6fae3f',
                data: data.data
              }]
            },
            options: {
              responsive: true,
              legend: {
                position: 'top',
              },
              title: {
                display: true,
                text: 'Population Bar Chart'
              }
            }
          });

        }
      });

    });

  </script>
{% endblock %}
templates/base.html
//templates/base.html
<!DOCTYPE html>
<html lang="en">
<head>
    <meta charset="UTF-8" name="viewport" content="width=device-width, initial-scale=1"/>
 <title>{% block title %}Django Highcharts {% endblock %}</title>
<link rel="stylesheet" href="https://stackpath.bootstrapcdn.com/bootstrap/4.5.0/css/bootstrap.min.css" integrity="sha384-9aIt2nRpC12Uk9gS9baDl411NQApFmC26EwAOH8WgZl5MYYxFfc+NcPb1dKGj7Sk" crossorigin="anonymous">
</head>
<body>
<nav class="navbar navbar-expand-lg navbar-light bg-light">
  <a class="navbar-brand" href="#">Cairocoders</a>
  <button class="navbar-toggler" type="button" data-toggle="collapse" data-target="#navbarNavAltMarkup" aria-controls="navbarNavAltMarkup" aria-expanded="false" aria-label="Toggle navigation">
    <span class="navbar-toggler-icon"></span>
  </button>
  <div class="collapse navbar-collapse" id="navbarNavAltMarkup">
    <div class="navbar-nav">
   <a class="nav-item nav-link active" href="">Home</a>
    </div>
  </div>
</nav>
 <div class="container" style="padding:20px;">
    <div class="col-md-12 well">
        <h3 class="text-primary">How to Use Chart-js with Django using jquery Ajax Bar Chart Example</h3>
        <hr style="border-top:1px dotted #ccc;"/>
  {% block content %} {% endblock %}
    </div>
    </div>
</body>
</html>


